SPC · Section Part II · Long answer

Practical Skills and Data Analysis

9 questions — reveal each answer and worked solution.

2011-11II · Long answerd5Practical Skills and Data Analysis · speed of light measurement technique

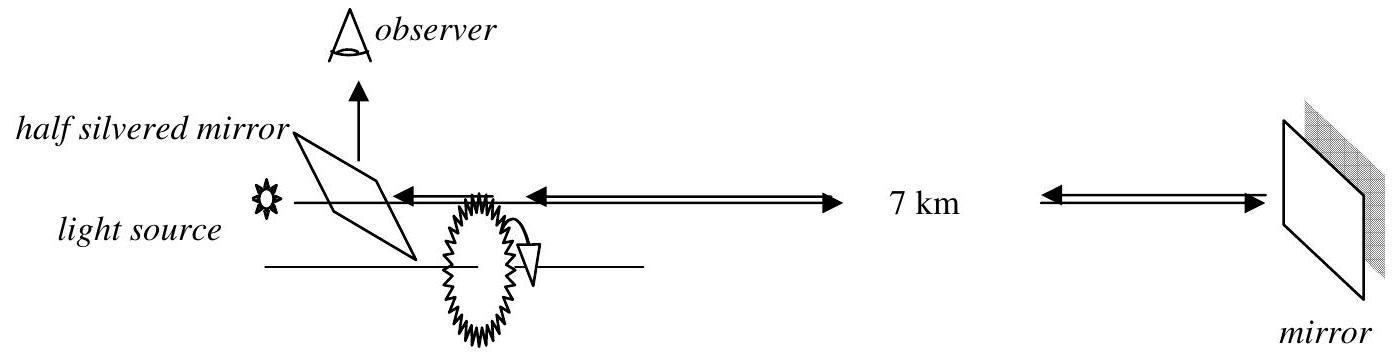
In one of the original experiments to measure the speed of light, carried out by Fizeau in 1849, a beam of light was sent to a distant mirror 7 km away and reflected back, passing through the teeth of a rapidly rotating cogwheel. It is easy to detect when the light is obscured by a tooth on its return path and a reduction in intensity is observed. A simplified diagram of the setup is shown below. The toothed cog has 720 teeth and rotates several hundred times per second.
figure

a) At a rate of rotation of 283 rps (rotations per second) extinction is observed. Speeding up the cog, extinction is next observed at 313 rps. Explain why the light is extinguished at a particular rate of rotation. b) Explain why there are two (or more) rates at which extinction is observed. c) If $n+1 / 2$ teeth cross the beam at 283 rps, state how many teeth must cross the beam at 313 rps? Calculate the number of teeth that cross the beam per second at each of the two speeds, the difference in the number of teeth crossing per second, and thus the time interval for one extra tooth to cross. (This is the travel time of the light beam) d) Calculate the speed of light from these measurements.

Show worked solution

This problem involves Fizeau's historic experiment to measure the speed of light using a rotating cogwheel.

Understanding the experimental setup:

The experiment consists of:
- A light source that sends a beam toward a mirror 7 km away
- A rotating cogwheel with 720 teeth placed in the path of the light
- Light passes through the gaps between teeth, reflects off the mirror, and returns
a) Why extinction occurs at a particular rotation rate:

For extinction to happen, the timing must be just right: 1. Light passes through a gap in the cogwheel 2. Light travels to the mirror (7 km away) and back (7 km return) 3. Total distance traveled = 14 km 4. During this travel time, the cogwheel rotates 5. When the light returns, a tooth (not a gap) must be in the path

This blocks the returning light, causing the observed extinction (reduction in intensity).

b) Why there are multiple extinction rates:

The key insight is that the cogwheel doesn't need to rotate by exactly one tooth position. It could rotate by:
- 1 tooth + 1 gap (minimum for extinction)
- 2 teeth + 2 gaps
- 3 teeth + 3 gaps
- And so on...
Each complete "tooth + gap" pair takes the same amount of time to pass, so multiple rotation speeds will cause extinction.

c) Calculating the teeth crossing rate: At 283 rps: Number of teeth per second = $283 \times 720 = 203,760$ teeth/second

At this speed, if $n + \frac{1}{2}$ teeth cross the beam, extinction occurs.

At 313 rps: Number of teeth per second = $313 \times 720 = 225,360$ teeth/second How many teeth cross at 313 rps?

Since we're at the next extinction speed, one additional tooth has crossed: $$\text{Teeth crossing} = n + \frac{1}{2} + 1 = n + \frac{3}{2}$$

Difference in crossing rate: $$225,360 - 203,760 = 21,600 \text{ extra teeth per second}$$ Time for one extra tooth to cross: $$t = \frac{1}{21,600} = 4.63 \times 10^{-5} \text{ s}$$

This time interval equals the round-trip travel time of the light!

d) Calculating the speed of light:

The light travels a total distance of 14 km (7 km each way) in the time calculated above.

$$c = \frac{\text{distance}}{\text{time}} = \frac{14,000 \text{ m}}{4.63 \times 10^{-5} \text{ s}}$$

$$c = 3.0 \times 10^8 \text{ m/s}$$

Final answer: The speed of light is approximately $3.0 \times 10^8$ m/s, which matches the modern accepted value!
2013-15II · Long answerd4Practical Skills and Data Analysis · thermometer calibration and sensor non-linearity

To calibrate a mercury-in-glass thermometer (an ordinary glass thermometer with a column of mercury), it is placed in ice-water and $0^{\circ} \mathrm{C}$ is marked on the glass stem at the end of the mercury column. It is then placed in boiling water and $100^{\circ} \mathrm{C}$ is marked on the glass stem. One hundred equal divisions are then marked on the glass stem between these two fixed points to form a linear centigrade scale.

A thermistor has a resistance which decreases as the temperature increases, rapidly at first and then, at low resistance, less rapidly. A thermistor thermometer is calibrated by placing it in ice-water; its resistance is $1020 \Omega$. When placed in boiling water its resistance is $154 \Omega$. a) Sketch on the axes (include key values on the axes), how the resistance of a thermistor varies with temperature measured with a mercury thermometer. b) Sketch on the axes (include key values on the axes), a linear temperature scale for the thermistor using the temperatures and resistances at the two fixed points. c) If the thermistor scale is taken to be linear, what is the change of resistance per $1^{\circ} \mathrm{C}$ between $1020 \Omega$ and $154 \Omega$? d) When the thermistor is used to measure your body temperature, the resistance is found to be $292 \Omega$. What change of resistance occurs when the thermistor is warmed up to body temperature from $0^{\circ} \mathrm{C}$? e) From your answers to (b) and (c) calculate the temperature of your body using the thermistor temperature scale. Comment on your answer.

Show worked solution

This problem involves temperature measurement with thermistors vs mercury thermometers.

Understanding the two types of thermometers: Mercury thermometer:
- Linear relationship between volume and temperature
- Mercury expands uniformly with temperature
- Scale is linear: equal divisions represent equal temperature changes
Thermistor thermometer:
- Resistance decreases with temperature (NTC thermistor)
- Non-linear relationship: resistance changes rapidly at high T, slowly at low T
- Need to calibrate against known reference points
Given data:
- At $0^{\circ}$C: $R = 1020 \Omega$
- At $100^{\circ}$C: $R = 154 \Omega$
a) Resistance vs. temperature graph: Actual thermistor behavior:

The relationship is exponential: $$R(T) = R_0 e^{\beta/T}$$

Where $T$ is absolute temperature (Kelvin) and $\beta$ is a material constant.

Graph characteristics:
- Y-axis: Resistance ($\Omega$)
- X-axis: Temperature ($^{\circ}$C)
- Curve starts at $(0, 1020)$ and ends at $(100, 154)$
- Shape: Exponential decay - concave downward
- Steepest at low temperatures
- Flattens out at high temperatures
b) Linear thermistor scale: The approximation:

Instead of the actual exponential curve, we draw a straight line between the two calibration points:
- Line connects $(0, 1020)$ to $(100, 154)$
- This creates a "linearized" temperature scale
Equation of line: Using two-point form: $$R - 1020 = \frac{154 - 1020}{100 - 0}(T - 0)$$

$$R(T) = 1020 - 8.66T$$

Where $T$ is in $^{\circ}$C and $R$ is in $\Omega$.

c) Resistance change per degree:

From the linear scale equation: $$R(T) = 1020 - 8.66T$$

The coefficient of $T$ tells us the rate of change:

$$\frac{\Delta R}{\Delta T} = -8.66 \text{ } \Omega/^{\circ}\text{C}$$

The negative sign means resistance decreases as temperature increases.

d) Measuring body temperature: Given:
- Measured resistance: $R_{body} = 292 \Omega$
Change from $0^{\circ}$C reference: $$\Delta R = R_{initial} - R_{measured} = 1020 - 292$$

$$\Delta R = 728 \text{ } \Omega$$

e) Calculated body temperature: Using linear scale: $$\Delta R = 8.66 \times \Delta T$$

$$728 = 8.66 \times T$$

$$T = \frac{728}{8.66} = 84.0^{\circ}\text{C}$$

This is clearly wrong!

Normal human body temperature is about $37^{\circ}$C (or $98.6^{\circ}$F). A reading of $84^{\circ}$C would be fatal!

Why the error?

The linear scale is a poor approximation because: 1. Thermistor response is highly non-linear 2. Most resistance change happens at low temperatures 3. At body temperature range ($30-40^{\circ}$C), the curve is flatter 4. Linear extrapolation overestimates temperature significantly

Correct approach:

For accurate readings, you'd need to:
- Use the actual exponential calibration curve
- Or calibrate specifically in the body temperature range
- Or use a lookup table/chart
This demonstrates the importance of understanding sensor non-linearity in practical measurements!

2017-11II · Long answerd4Practical Skills and Data Analysis · speed of light measurement technique

An early measurement of the speed of light was made by a Danish scientist Ole Rømer in the 1670s. He observed the period of orbit of Io, the closest known moon of Jupiter at that time. The mean time interval between successive eclipses of Io by Jupiter is equal to its period of orbit, 42 h 28 min 42 s. However, for some months during the Earth year (region $\mathbf{A}$ in the Earth's orbit), the period of Io's orbit increased by a few seconds, whilst during other times (region B in the Earth's orbit) the period decreased.

It can be assumed that radius of Jupiter's orbit about the Sun is much larger than the Earth's.
a) Sketch a diagram of the orbits of the Earth (showing its direction of motion) and Jupiter to indicate where (A and B) these variations from the mean period would be greatest.
b) The radius of the Earth's circular orbit is $1.5 \times 10^{11} \mathrm{~m}$ and its period can be taken as 365 days. If the variation of the period of the orbit of Io is up to 15 s longer or shorter than the mean, what value does this give for the speed of light?
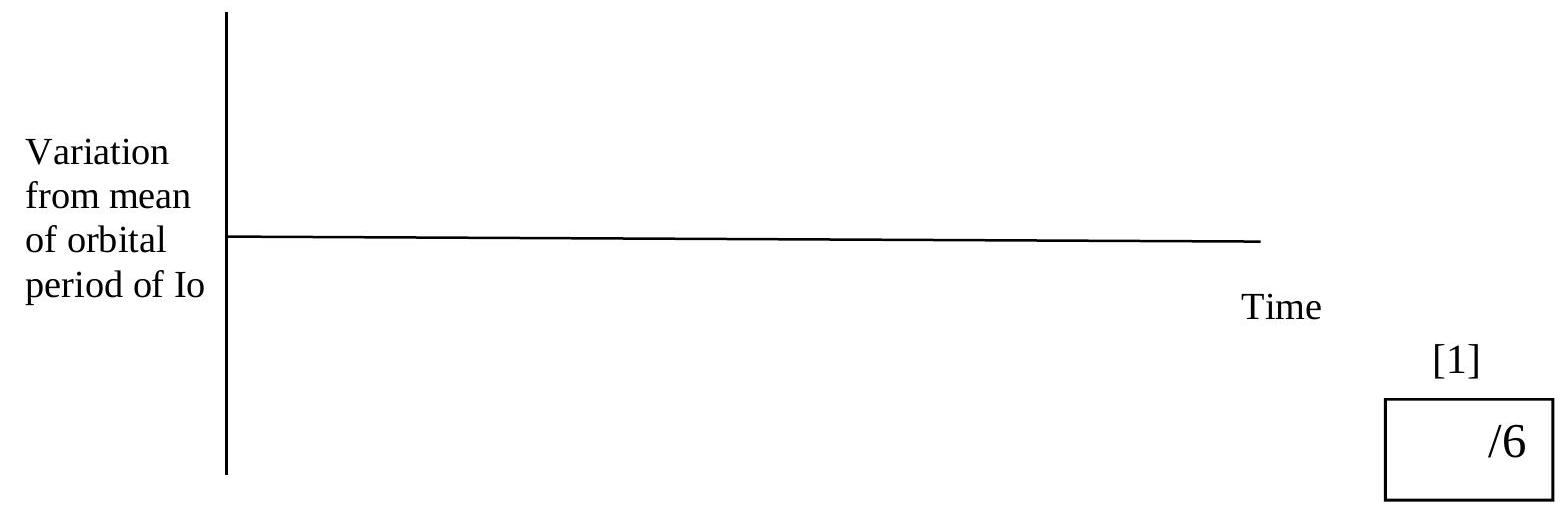
c) Sketch a graph on the axes showing the variation in the period of Io's orbit for one Earth year. Give values on the axes and mark on $\mathbf{A}$ and $\mathbf{B}$.

figure
Show worked solution

a) Diagram should show Earth orbiting Sun counter-clockwise, with Jupiter outside. Point A is where Earth moves away from Jupiter (maximum delay), Point B is where Earth moves toward Jupiter (minimum delay).

b) Speed of Earth: $v = 2\pi \times 1.5 \times 10^{11} / (365 \times 24 \times 3600) = 29900$ m/s

Distance traveled in 42h 28m 42s: $d = 29900 \times (42 \times 3600 + 28 \times 60 + 42) = 4.57 \times 10^{9}$ m

Light travels this extra distance in 15 s: $c = 4.57 \times 10^{9} / 15 = 3.0 \times 10^{8}$ m/s

c) Graph shows sine/cosine curve with period 1 year, with A marked at maximum (Earth moving away from Jupiter) and B at minimum (Earth moving toward Jupiter).

2019-8II · Long answerd4Practical Skills and Data Analysis · graph analysis and velocity averaging

A ball is dropped from rest at height $h$, and accelerates towards the ground, reaching it with final speed $v_{f}$ after time $t$. Ignore air resistance.
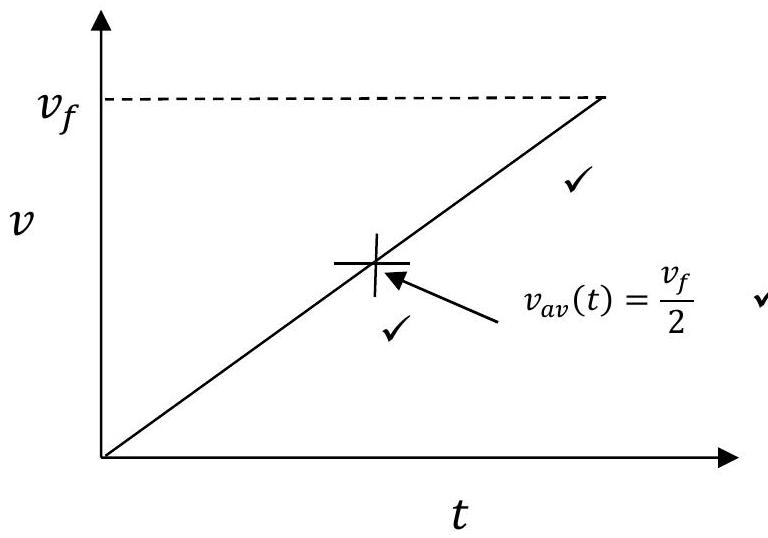
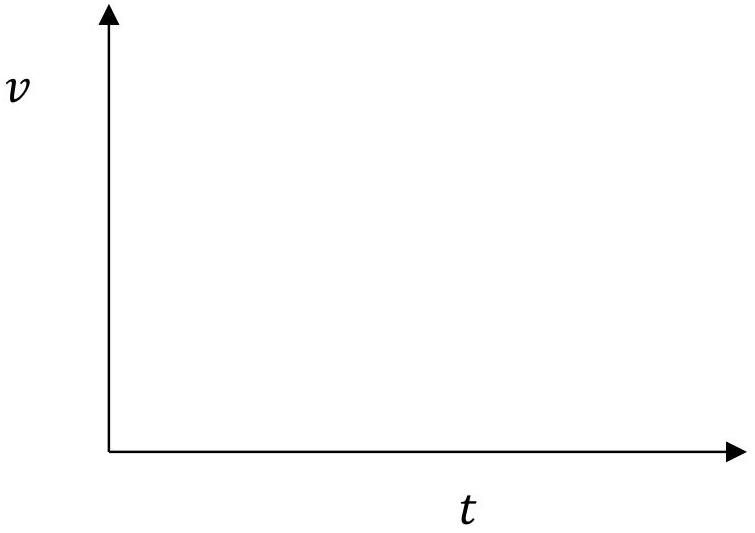
a) Sketch a $v-t$ graph and on the graph mark on the average speed, $v_{a v}(t)$. State its value in terms of $v_{f}$.

figure

b) Describe, referring to the area under the curve in your graph, what is meant by this time averaged speed, $v_{a v}(t)$.
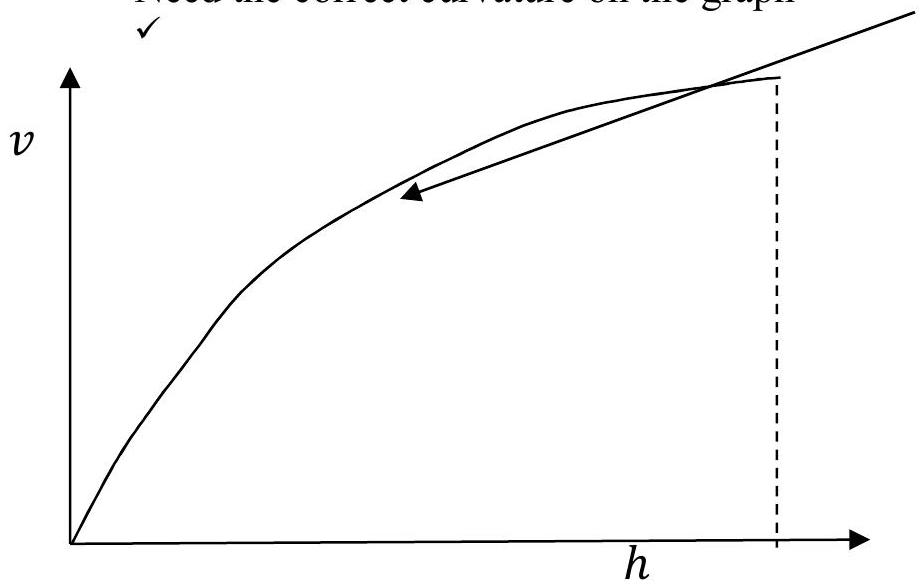
c) It can be of interest to determine the average speed over a distance instead. Sketch a suitable graph to help explain the idea of distance averaged speed, $v_{a v}(s)$.
d) (i) Referring to your graph, use it to explain what is meant by distance averaged speed, $v_{a v}(s)$.
(ii) Calculate the distance averaged speed, $v_{a v}(s)$ in terms of $v_{f}$.

Show worked solution

a) Straight line from (0,0) to ($t$, $v_{f}$). Average speed marked at half height: $v_{av}(t) = \frac{v_{f}}{2}$

figure

b) $v_{av}(t)$ is the area under the line (= distance travelled = $\frac{1}{2} v_{f} t$) divided by $t$ to give $\frac{v_{f}}{2}$.

c) Graph of $v$ against $h$ (height): $v = \sqrt{2gh}$, so $v \propto \sqrt{h}$ (curve with decreasing gradient)

figure

d) (i) $v_{av}(s)$ is the area under the $v$-$h$ curve divided by $h$.
(ii) Area = $\int_{0}^{h} \sqrt{2gh} \, dh = \frac{2}{3} \sqrt{2g} h^{\frac{3}{2}}$. So $v_{av}(s) = \frac{\frac{2}{3} \sqrt{2g} h^{\frac{3}{2}}}{h} = \frac{2}{3} \sqrt{2gh} = \frac{2}{3} v_{f}$.

2019-11II · Long answerd5Practical Skills and Data Analysis · calorimetry and cooling-curve analysis

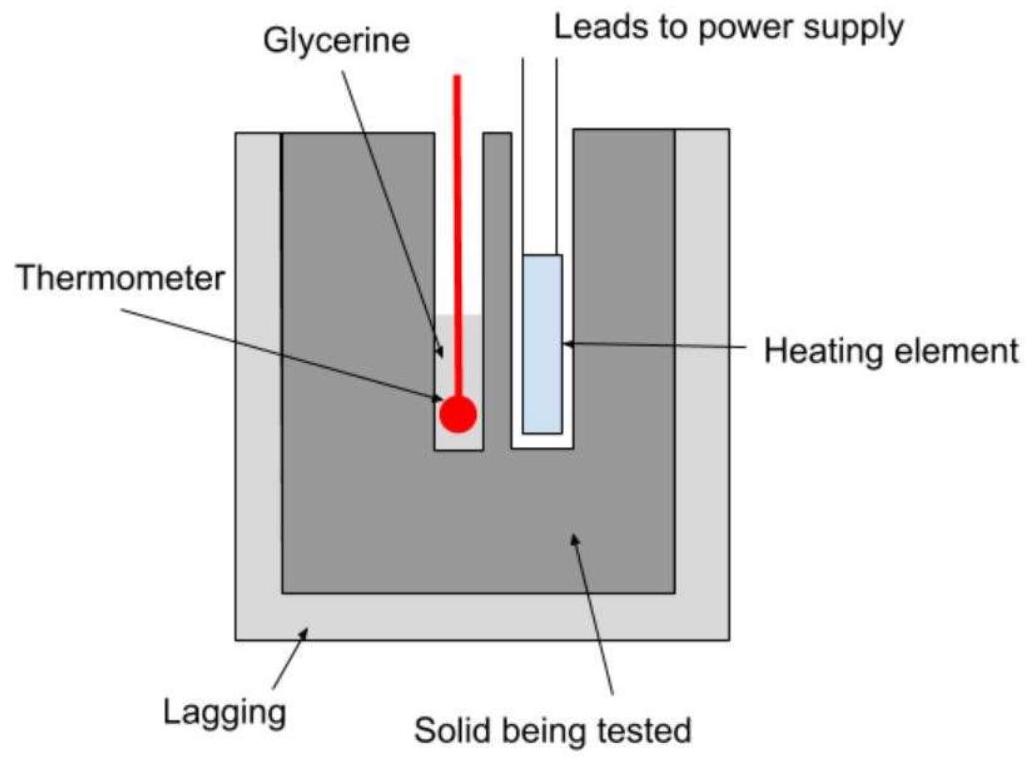
The Specific Heat Capacity (SHC), $c$, of a material is defined as the energy needed to raise the temperature of 1 kg of material by $1^{\circ} \mathrm{C}$: $\Delta H = m c \Delta T$. An experiment to measure the SHC uses Newton's Law of Cooling:

$$\frac{\Delta Q}{\Delta t}=k\left(T-T_{0}\right)$$

where $T$ is the temperature of the material, $T_{0}$ is the temperature of the surroundings and $k$ is a constant.

figure
figure

a) What would affect the value of $k$?
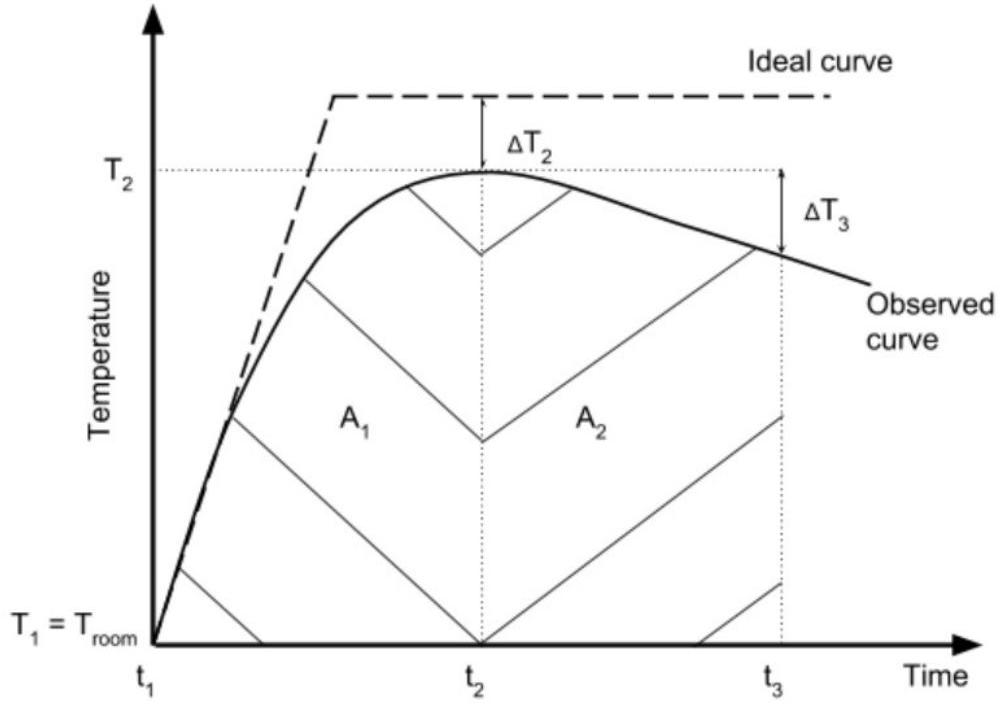
b) The times $t_{1}, t_{2}$ and $t_{3}$ are equally spaced, with $t_{2}$ being the time at which the temperature reaches its maximum. Explain why $t_{2}$ is some time after the change in gradient of the ideal curve.
c) Use Newton's Law of Cooling to explain why the area $A_{2}$ is proportional to the thermal energy lost between times $t_{2}$ and $t_{3}$.
d) Hence explain why $\frac{\Delta T_{2}}{\Delta T_{3}}=\frac{A_{1}}{A_{2}}$.
e) Hence find an expression for $c$ in terms of the quantities you could measure in the experiment and off the graph.

Show worked solution

This problem involves Newton's Law of Cooling and experimental calorimetry.

Understanding the cooling curve:

When heating an object and then letting it cool:
- Temperature rises during heating phase
- Temperature exponentially decays toward room temperature during cooling
- The curve depends on power input, heat loss, and object properties
a) What affects $k$:

The constant $k$ in Newton's cooling law: $$\frac{dT}{dt} = -k(T - T_0)$$

depends on:
- Surface area: Larger area = faster heat transfer
- Material properties: Thermal conductivity, emissivity
- Surface characteristics: Color, texture
- Insulation: Any lagging or insulation around the object
NOT dependent on:
- Temperature of object
- Color of object (for same surface properties)
b) Why maximum occurs after heating stops:

Temperature sensor is placed a distance from heater. - Heat takes time to conduct through sample
- Temperature at sensor lags behind temperature near heater
- When heating stops, heater continues to warm sample briefly
- Maximum $T$ occurs when heat from heater stops arriving
This is a common issue in calorimetry called "thermal lag."

c) Area $A_2$ represents thermal energy lost:

Graph shows temperature vs. time. The area under the curve above room temperature represents $\int(T - T_0)dt$, which is proportional to thermal energy lost.

Since $\frac{dQ}{dt} = k(T - T_0)$: $$Q_{lost} = \int k(T - T_0)dt \propto A_2$$

d) Why temperature ratio equals area ratio:

Both heating and cooling follow Newton's law with the same $k$. - Heating: energy in = energy out + energy stored
- Cooling: all stored energy is lost
Geometric similarity of the heating/cooling curves means the ratio of temperature changes equals the ratio of areas.

e) Calculating specific heat capacity:

From energy balance: $$P\Delta t = mc\Delta T + Q_{lost}$$

Where $\Delta T$ is temperature rise above room temperature at peak.

$$c = \frac{P\Delta t - Q_{lost}}{m\Delta T}$$

Measure from graph: power $P$, time $\Delta t$, areas $A_1, A_2$, temperature rise $\Delta T$ and decay $\Delta T_3$.

2022-7II · Long answerd2Practical Skills and Data Analysis · oil-film molecular-size estimation

In an experiment to measure the length of an oil molecule that has a hydrophilic end (one end of the long molecule sticks in a water surface), a drop of the oil of volume $0.1 \mathrm{~mm}^{3}$ is touched on to the surface of some water in a tank. The oil spreads out to give a circular patch of area $1000 \mathrm{~cm}^{2}$. What is the length of the oil molecule?

Show worked solution

This problem involves estimating molecular size from oil film spreading.

Given:
- Oil volume: $V = 0.1$ mm$^{3}$ $= 0.1 \times 10^{-9}$ m$^{3}$
- Patch area: $A = 1000$ cm$^{2}$ $= 1000 \times 10^{-4}$ m$^{2}$ $= 0.1$ m$^{2}$
Understanding the phenomenon:

Oil molecules are amphiphilic - they have:
- Hydrophilic (water-loving) head
- Hydrophobic (water-fearing) tail
When oil touches water:
- The hydrophilic heads stick to the water surface
- The hydrophobic tails point upward
- The oil spreads into a monolayer (one molecule thick)
Film thickness calculation:

Assuming the oil spreads into a uniform film: $$V = A \times h$$

where $h$ is the film thickness (molecular length).

$$h = \frac{V}{A} = \frac{0.1 \times 10^{-9}}{0.1}$$

$$h = 10^{-9} \text{ m} = 1 \text{ nm}$$

Physical significance:

This is a classic experiment for determining molecular size! The result of 1 nm is typical for oil molecules, confirming that matter is made of discrete particles with dimensions on the nanometer scale.

Answer: $h = 10^{-9}$ m $= 1$ nm
2024-16II · Long answerd4Practical Skills and Data Analysis · horizon distance geometry and time estimation

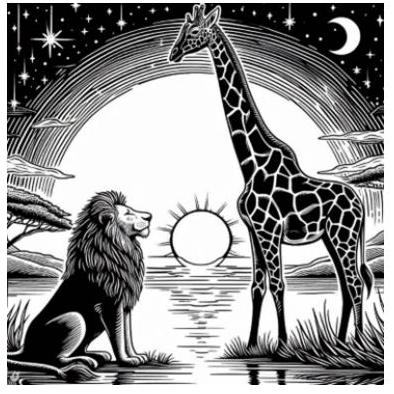
A lion, with eyes 80 cm above the ground, sees the sun set at 8 pm.

A giraffe stands with its eyes at 3.5 m above the ground.

figure

(Radius of Earth $=6370 \mathrm{~km}$)

(a) (i). Sketch a diagram from a side-view, of an arc of the Earth and the line to the horizon as seen from an eye located on the Earth's surface and an eye located at a small height $h$ above the surface.
(ii). Hence obtain an expression for the an approximate distance to the horizon $d$, as seen by an eye at height $h$.
Determine an expression for the angle $\theta$ subtended at the centre of the Earth by this distance.

(b) Calculate the difference in angles corresponding to the different heights of the giraffe's and the lion's eyes.
(c) Hence calculate the time at which the giraffe sees the Sun set.

Show worked solution

This problem involves geometry and horizon calculations.

Part (a) - Horizon distance: i) Diagram: Shows Earth's curved surface with observer at height $h$, line of sight tangent to surface at horizon point. ii) Horizon distance formula:

From right triangle geometry: $$(R + h)^{2} = R^{2} + d^{2}$$

$$R^{2} + 2Rh + h^{2} = R^{2} + d^{2}$$

For $h \ll R$: $d^{2} \approx 2Rh$

$$d \approx \sqrt{2Rh}$$

Angle subtended: $$\theta = \frac{d}{R} = \sqrt{\frac{2h}{R}}$$

Part (b) - Angle difference:

For lion ($h_{l} = 0.8$ m): $$\theta_{l} = \sqrt{\frac{2 \times 0.8}{6.37 \times 10^{6}}} = 5.0 \times 10^{-4} \text{ rad}$$

For giraffe ($h_{g} = 3.5$ m): $$\theta_{g} = \sqrt{\frac{2 \times 3.5}{6.37 \times 10^{6}}} = 1.05 \times 10^{-3} \text{ rad}$$

$$\Delta \theta = \theta_{g} - \theta_{l} = 5.5 \times 10^{-4} \text{ rad}$$

Part (c) - Time difference:

Earth rotates $2\pi$ radians in 24 hours: $$\text{Time} = \frac{\Delta \theta}{2\pi} \times 24 \times 3600 \text{ seconds}$$

$$t = \frac{5.5 \times 10^{-4}}{2\pi} \times 86400 \approx 7.5 \text{ seconds}$$

Giraffe sees sunset at 8:00:08 pm (about 7.5 seconds AFTER the lion)

Physical insight:

Being taller lets you see farther over the horizon! The giraffe sees the sun set later because it can "see around" the curve of the Earth slightly more than the lion can.

2024-17II · Long answerd5Practical Skills and Data Analysis · Fermi estimation — molecular statistics

Imagine that after finishing this competition paper, you drink a mug of tea. You can estimate how many molecules of the water in your mug were previously drunk by Julius Caesar when he was alive.

Assume that the water molecules that went through him in his lifetime have been circulated through the oceans and in rain and are thoroughly mixed with water in our present day.

List of variables needed:

figure
  • The Radius of the Earth (in m) is $R_{\mathrm{E}}$.
  • The average depth of the Earth's oceans (in m) is $d$.
  • The fraction of the Earth's surface covered by ocean is $f_{\text {ocean }}$.
  • The density of water (in $\mathrm{kg} \mathrm{m}^{-3}$) is $\rho$.
  • The molar mass (mass of one mole of water in grams) is $M_{\text {water }}=\frac{M_{\text {water }}}{10^{3}}$ in kg .
  • The internal volume of a mug (in $\mathrm{m}^{3}$) is $V_{\text {mug }}$.
  • The volume of water a human drinks in a day (in $\mathrm{m}^{3}$) is $V_{\text {day }}$.
  • Caesar's lifetime (in days) is $t$.
  • The Avogadro Number is . (This is the number of molecules of a substance in 1 mole of that substance.)

(a) Form an equation, using the list of variables above, which you could use to calculate how many molecules of the water in your mug were previously drunk by Julius Caesar when he was alive.

Explain your steps clearly, stating what you're calculating at each stage. Make use of the units to help you.

Marks will be awarded for a clear process and explanation of your equation, as well as the equation itself.

As a suggestion, you might obtain expressions for
(i). the number of molecules consumed by Caesar in his lifetime
(ii). the number of molecules in the oceans
(iii). the number of molecules in a mug.

(b) Write down an overall expression for the number of molecules drunk by Caesar that you might find in your own mug.

(An approximate result seems to be about $10^{8}$ molecules.)

Show worked solution

This problem involves estimation and molecular statistics.

Understanding the mixing assumption:

Water molecules that Caesar drank have been thoroughly mixed through Earth's oceans over 2000+ years. We can assume uniform distribution.

Part (a) - Step-by-step derivation: i) Molecules Caesar consumed:

Volume per day: $V_{day}$ Days in lifetime: $t$ Total volume: $V_{total} = t \times V_{day}$

Moles of water: $n = \frac{\rho V_{total}}{M}$ Molecules: $N_{Caesar} = n \times N_{A} = \frac{\rho t V_{day}}{M} \times N_{A}$

ii) Molecules in oceans:

Ocean volume: $V_{ocean} = f \times 4\pi R_{E}^{2} \times d$

Molecules: $N_{ocean} = \frac{\rho V_{ocean}}{M} \times N_{A}$

iii) Molecules in mug: $$N_{mug} = \frac{\rho V_{mug}}{M} \times N_{A}$$ Part (b) - Caesar molecules in your mug:

Fraction of ocean molecules that Caesar drank: $$f_{Caesar} = \frac{N_{Caesar}}{N_{ocean}} = \frac{t V_{day}}{f \cdot 4\pi R_{E}^{2} d}$$

Expected number in your mug: $$N = N_{mug} \times f_{Caesar}$$

$$N = \frac{\rho V_{mug}}{M} N_{A} \times \frac{t V_{day}}{f \cdot 4\pi R_{E}^{2} d}$$

$$N = V_{mug} \left(\frac{\rho N_{A}}{M}\right) \frac{t V_{day}}{f \cdot 4\pi R_{E}^{2} d}$$

Numerical estimate:

Using typical values: $N \approx 10^{8}$ molecules

Physical insight:

You probably drink about 100 million water molecules that Caesar drank! This shows how incredibly many molecules are in even small amounts of matter, and how thoroughly mixed Earth's water has become over time.

2025-12II · Long answerd4Practical Skills and Data Analysis · graph analysis / experimental data interpretation

It's Hardly Rocket Science

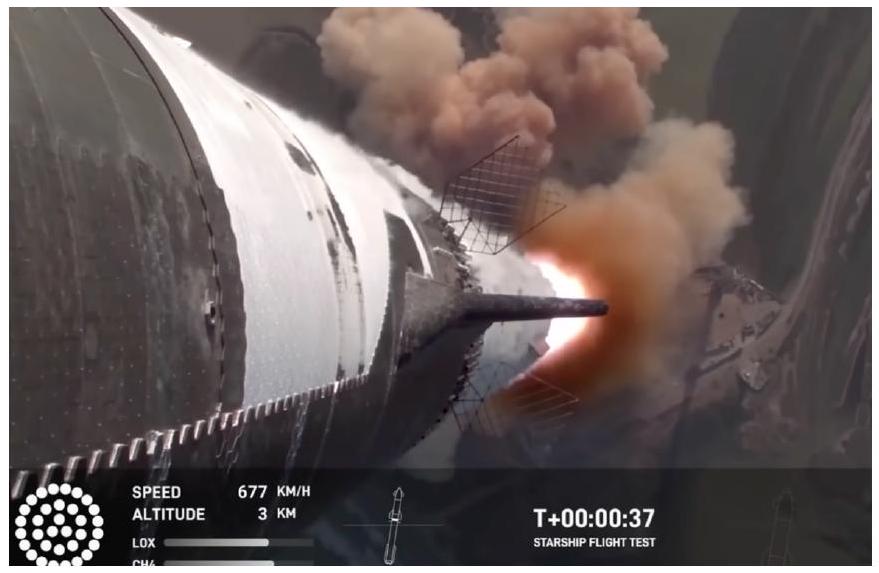
In recent years there has been a rapid development in space launch vehicles. Livestreams of launches are often available online; many sitting this paper will have seen them. In these videos, telemetry from the spacecraft is usually shown on screen alongside the video. An example (courtesy of YouTube) is shown below in Fig. 14.

figure

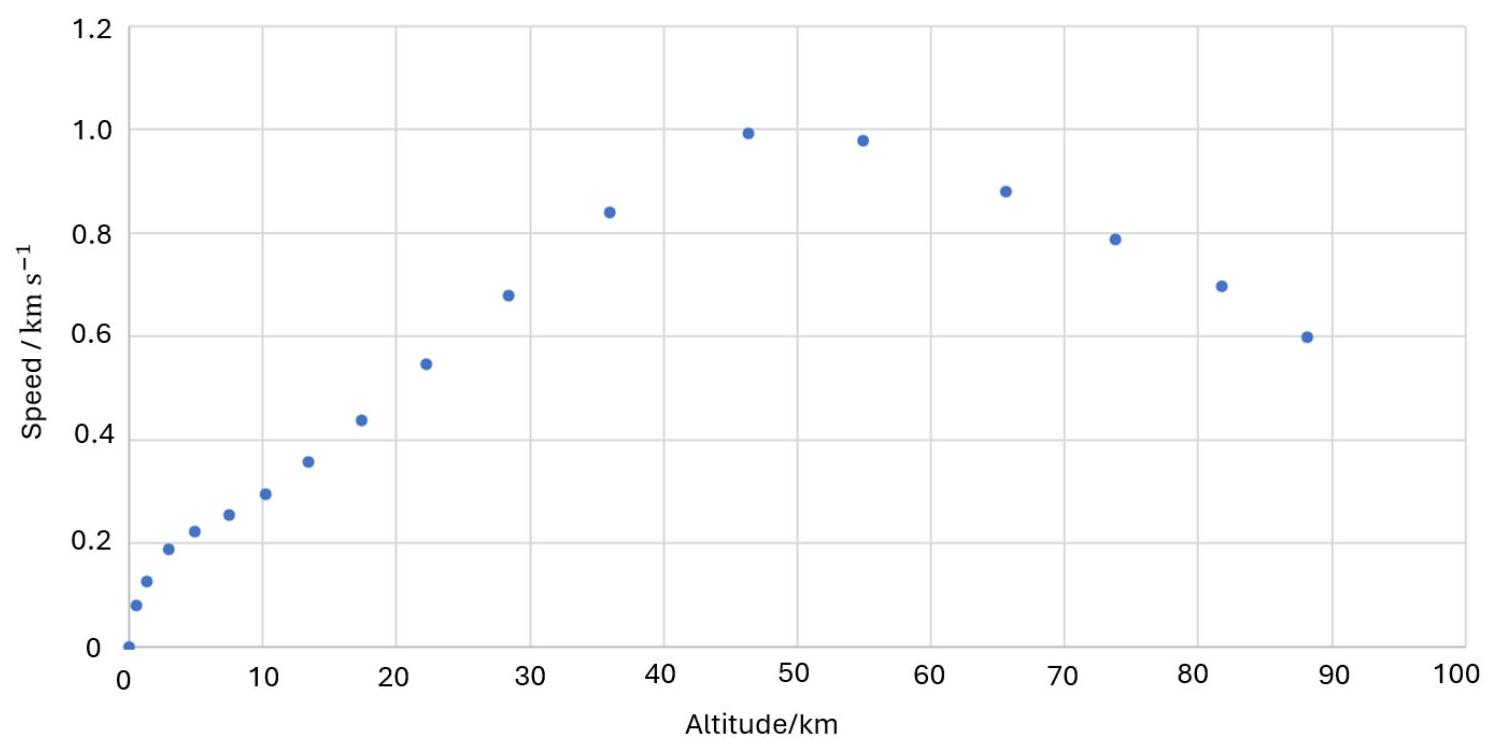
By watching the telemetry from such a flight, a speed vs altitude graph can be plotted for the spacecraft, as in Fig. 15:

figure

(a) What happened when the craft reached around 50 km altitude? Describe what it is doing.
(b) Using data from the graph from 55 km onwards, calculate the acceleration. Comment on your answer.
(c) An important concept in launching a rocket out of the atmosphere is the 'Max Q'. This is essentially the moment when the craft experiences maximum stress from friction with the atmosphere. Explain the factors affecting the position of Max Q, and therefore suggest a coordinate on the graph where Max Q might occur.

Show worked solution

This problem involves rocket dynamics and atmospheric drag.

Part (a) - Event at 50 km:

The speed reaches a MAXIMUM at about 50 km altitude, then decreases. This is when:
- Rocket motor SWITCHES OFF
- Engine stops providing thrust
- Rocket continues upward due to momentum
- Gravity now slows it down
Part (b) - Acceleration calculation:

Using data from graph (55 km onwards):
- $u = 1000$ m/s at 55 km
- $v = 600$ m/s at 88 km
- $s = 33000$ m
Using $v^{2} = u^{2} + 2as$: $$600^{2} = 1000^{2} + 2a \times 33000$$

$$360000 = 1000000 + 66000a$$

$$-640000 = 66000a$$

$$a = -9.7 \text{ m/s}^{2}$$

Comment:

This is essentially free-fall acceleration ($g = 9.8 \text{ m/s}^{2}$ downward), confirming the rocket is coasting with minimal thrust or air resistance at this altitude.

Part (c) - Max Q position:

Max Q (maximum dynamic pressure) occurs when: $$q = \frac{1}{2}\rho v^{2}$$

is maximum.

This depends on:
- Velocity $v$ (increases with time)
- Air density $\rho$ (decreases with height)
Max Q occurs at the balance point where velocity is high but air density is still significant.

Looking at the graph:
- Velocity peaks around 50 km
- Air density decreases exponentially with height
Answer: Max Q occurs around 30-50 km altitude

This is typically the most stressful part of the launch for the vehicle structure.