IPC · Section A · MCQ

Practical Skills and Data Analysis

18 questions — reveal each answer and worked solution.

2010-10A · MCQd2Practical Skills and Data Analysis · Reducing random error (graph technique)

(2010-10) To measure the value of a fixed resistor, readings of voltage and current can be taken and the resistance calculated from these.

The method likely to give the most accurate answer is:
A. Carefully take a single reading of V and I and use the equation $\mathrm{V} = \mathrm{IR}$ to calculate resistance.
B. Take several different readings of V and I , calculate R for each and take an average.
C. Take several different readings of V and I , plot a graph of V against I and find R from the gradient
D. Assume that the value stated by the manufacturer is accurate as they have obviously tested all their resistors
E. Look it up on the internet

Reveal answer
AnswerC
Show worked solution

To determine the most accurate method for measuring the resistance of a fixed resistor using voltage and current measurements, it is important to consider the sources of measurement error and the precision of each method.

Measurement involves two primary readings: voltage $V$ and current $I$. The resistance $R$ is calculated using Ohm's law:

$$ V = IR $$

Rearranging for resistance gives:

$$ R = \frac{V}{I} $$

One single measurement of $V$ and $I$ may suffer from random fluctuations and measurement inaccuracies. Consequently, taking multiple readings helps in minimizing random errors, providing a more reliable resistance estimation.

One method involves multiple measurements of $V$ and $I$, each used to calculate a separate value of $R$. An average of these values is computed. However, this does not fully utilize all measurements and may still give rise to cumulative errors.

An alternative method is to plot $V$ as a function of $I$, resulting in a linear graph according to Ohm's law. The equation of a straight line is given by:

$$ V = IR $$

On a graph of $V$ against $I$, $R$ corresponds to the gradient (slope) of the line. This approach benefits from using regression or linear fitting techniques to find the slope, thereby averaging out random measurement errors over all data points.

Moreover, plotting allows for easy identification and omission of outliers, which might skew the resistance value if averaged directly from individual calculations. This approach also visually confirms the linearity of the data, supporting the assumption of Ohm's law validity over the measured range.

The manufacturer's listed resistance may not consider individual experimental conditions and variations, and looking up information on the Internet does not ensure precision or applicability to the specific resistor in question.

Therefore, the most reliable and accurate method is to plot a graph of $V$ against $I$ and determine $R$ from the gradient, as encapsulated by option C.
2011-1A · MCQd3Practical Skills and Data Analysis · Unit conversion & powers of ten

(2011-1) In imperial units, length can be measured in inches where 1.00 inch $=2.54 \mathrm{~cm}$. A block of metal has a volume of 2.00 cubic inches. The volume in metric units is:
A. $\quad 3.28 \times 10^{-5} \mathrm{~m}^{3}$
B. $\quad 32.77 \times 10^{-4} \mathrm{~m}^{3}$
C. $\quad 5.08 \times 10^{-2} \mathrm{~m}^{3}$
D. $\quad 12.90 \times 10^{-2} \mathrm{~m}^{3}$
E. $\quad 3.28 \times 10^{-1} \mathrm{~m}^{3}$

Reveal answer
AnswerA
Show worked solution

To convert the volume from imperial units (cubic inches) to metric units (cubic meters), we first need to understand the conversions involved.

Given: 1.00 inch = 2.54 cm

We need to convert cubic inches to cubic meters. Start by converting cubic inches to cubic centimeters and then convert cubic centimeters to cubic meters.

Using the conversion factor, we find that $$ 1.00 \mathrm{cubic inch} = (2.54 \mathrm{cm} )^3 = (2.54)^3 \mathrm{cm} ^3 $$

Calculating $(2.54)^3$, we get: $$ 2.54^3 = 2.54 \times 2.54 \times 2.54 = 16.387064 \mathrm{cm} ^3 $$

Thus, 1 cubic inch is equivalent to 16.387064 cubic centimeters. Now, converting cubic centimeters to cubic meters involves knowing that: $$ 1 \mathrm{cm} ^3 = 1 \times 10^{-6} \mathrm{m} ^3 $$

Therefore, $$ 1 \mathrm{cubic inch} = 16.387064 \mathrm{cm} ^3 = 16.387064 \times 10^{-6} \mathrm{m} ^3 $$

Now, given that the volume of the block is 2.00 cubic inches, the volume in cubic meters is: $$ 2.00 \times 16.387064 \times 10^{-6} \mathrm{m} ^3 $$

Performing the multiplication: $$ 2.00 \times 16.387064 \times 10^{-6} = 32.774128 \times 10^{-6} \mathrm{m} ^3 $$

Simplifying the expressions, this becomes: $$ 32.774128 \times 10^{-6} \mathrm{m} ^3 = 3.2774128 \times 10^{-5} \mathrm{m} ^3 $$

Rounding this value to three significant figures, we approximate: $$ 3.28 \times 10^{-5} \mathrm{m} ^3 $$

This corresponds to option A in the problem statement: A. $3.28 \times 10^{-5} \, \text{m}^3$

2012-2A · MCQd3Practical Skills and Data Analysis · Uncertainty propagation (dominant error)

(2012-2) The specific heat capacity of a metal block is measured by using a small electrical heater and measuring the corresponding change in temperature. The specific heat capacity of the block is given by the equation:
specific heat capacity $=$ Energy transferred $/$ (mass $\times$ change in temperature)
All of the measurements needed are shown below.
Which of the readings will cause the greatest uncertainty in the final answer?
A Mass of block $=1.2000 \mathrm{~kg} \pm 0.1 \mathrm{~g}$
B Voltage of heater $=12.0 \mathrm{~V} \pm 0.1 \mathrm{~V}$
C Current through heater $=4.0 \mathrm{~A} \pm 0.1 \mathrm{~A}$
D Rise in temperature $=30^{\circ} \mathrm{C} \pm 1^{\circ} \mathrm{C}$
E Time heater used for $=10$ minutes $\pm 2$ seconds

Reveal answer
AnswerD
Show worked solution

To find out which measurement causes the greatest uncertainty in the calculation of the specific heat capacity, we need to consider the formula given:

$$ c = \frac{Q}{m \cdot \Delta T} $$

where $c$ is the specific heat capacity, $Q$ is the energy transferred, $m$ is the mass, and $\Delta T$ is the change in temperature.

The energy transferred by the heater can be expressed as:

$$ Q = V \cdot I \cdot t $$

where $V$ is the voltage, $I$ is the current, and $t$ is time.

The uncertainty in the measurement of any quantity $X$ with an absolute uncertainty $\pm \Delta X$ can be expressed as a percentage:

$$ \mathrm{Percentage Uncertainty} = \left(\frac{\Delta X}{X}\right) \times 100\% $$

To determine which quantity contributes the most to the overall uncertainty, we calculate the percentage uncertainties for each measurement:

1. Mass of the block: $$ m = 1.2000\, \mathrm{kg} \quad \Delta m = 0.1\, \mathrm{g} = 0.0001\, \mathrm{kg} $$ $$ \mathrm{Percentage Uncertainty in } m = \left(\frac{0.0001}{1.2000}\right) \times 100\% = 0.0083\% $$

2. Voltage of the heater: $$ V = 12.0\, \mathrm{V} , \quad \Delta V = 0.1\, \mathrm{V} $$ $$ \mathrm{Percentage Uncertainty in } V = \left(\frac{0.1}{12.0}\right) \times 100\% = 0.833\% $$

3. Current through the heater: $$ I = 4.0\, \mathrm{A} , \quad \Delta I = 0.1\, \mathrm{A} $$ $$ \mathrm{Percentage Uncertainty in } I = \left(\frac{0.1}{4.0}\right) \times 100\% = 2.5\% $$

4. Rise in temperature: $$ \Delta T = 30\, {}^\circ\mathrm{C} , \quad \Delta(\Delta T) = 1\, {}^\circ\mathrm{C} $$ $$ \mathrm{Percentage Uncertainty in } \Delta T = \left(\frac{1}{30}\right) \times 100\% = 3.33\% $$

5. Time heater used: $$ t = 10\, \mathrm{minutes} = 600\, \mathrm{seconds} , \quad \Delta t = 2\, \mathrm{seconds} $$ $$ \mathrm{Percentage Uncertainty in } t = \left(\frac{2}{600}\right) \times 100\% = 0.333\% $$

After calculating the percentage uncertainties for all measurements, we can see that the rise in temperature $\Delta T$ contributes the greatest uncertainty at 3.33%.

Thus, the measurement that contributes the greatest uncertainty in the specific heat capacity calculation is the rise in temperature, corresponding to option D.

2013-10A · MCQd2Practical Skills and Data Analysis · Reducing random error (timing many oscillations)

(2013-10) The time period for one oscillation of a long swinging pendulum is to be determined. The time is to be measured using a hand held stopwatch with a precision of $1 / 100^{\text {th }}$ of a second. The time period is known to be about 2 seconds. Which of the following measurement techniques best reduces the uncertainty on the measured value of the time period?
A. $\quad \text{Measuring the time for 10 swings and dividing the result by 10}$
B. $\quad \text{Measuring the time for 1 swing 10 times and taking an average}$
C. $\quad \text{Using a stopwatch that measures with a precision of }1/1000\text{ of a second}$
D. $\quad \text{Having 10 different people measure the time period and taking an average}$
E. $\quad \text{Ensure room temperature remains the same throughout the experiment}$

Reveal answer
AnswerA
Show worked solution

To determine the time period of a pendulum with minimal uncertainty using a stopwatch, which has a precision of $0.01$ seconds, it's crucial to analyze how measurement techniques affect the overall uncertainty.

The time period $T$ of a pendulum is approximately 2 seconds. When measuring time, systematic and random uncertainties can affect the precision and accuracy of results. Given that the time measurement can only be precise to within $0.01$ seconds, specific strategies can reduce the relative uncertainty.

If you measure the time for a single swing and repeat this process multiple times, the total uncertainty remains relatively high due to the short duration and individual errors in each measurement. The random errors due to reaction times and the resolution of the stopwatch will be consistently present in each trial.

A more effective technique involves measuring the time for multiple swings and then calculating the average time per swing. If you measure the time for 10 complete swings, the total measured time will be approximately $20$ seconds. This longer duration spreads out the effect of the stopwatch's minimum precision:

$$ \mathrm{Uncertainty in total time} = 0.01 \mathrm{seconds} $$

The average time period per swing is then given by:

$$ T_{ \mathrm{avg} } = \frac{T_{ \mathrm{total} }}{10} $$

where $T_{\text{total}}$ is the total time for 10 swings. The uncertainty in $T_{\text{avg}}$ is reduced by a factor related to the number of swings because:

$$ \mathrm{Relative uncertainty} = \frac{ \mathrm{Uncertainty in total time} }{T_{ \mathrm{total} }} = \frac{0.01}{20} $$

This results in a reduced relative uncertainty in the measurement of the time period.

Other options, such as having 10 different people measure the time or using a more precise stopwatch, do not inherently reduce the uncertainty due to the stopwatch resolution and reaction times. Therefore, measuring the time for 10 swings and dividing the result by 10 is an optimal technique that averages out individual errors and takes advantage of the relatively fixed resolution of the timing device over a longer duration.

Thus, option A best reduces the uncertainty on the measured value of the time period.

2014-2A · MCQd1Practical Skills and Data Analysis · Purpose of graph plotting

(2014-2) When taking measurements there are several different sources of error. The effect of these errors can be reduced by good scientific technique and through careful analysis.
The most significant reason for plotting a graph is to:
A. $\quad \text{Increase the precision of the readings}$
B. $\quad \text{Avoid parallax error}$
C. $\quad \text{Reduce the effect of random errors}$
D. $\quad \text{Ensure a fair test}$
E. $\quad \text{Recognise equipment failure}$

Reveal answer
AnswerC
Show worked solution

Plotting a graph is a widely used method in experimental physics and data analysis. It serves various purposes that aid the experimental process and results interpretation. Understanding these purposes helps us choose the correct justification for why graphs are fundamental tools.

The option to focus on is that plotting a graph "reduces the effect of random errors." Random errors are discrepancies that arise from unpredictable fluctuations in the measurement process, affecting the precision of the readings. These errors can be minimized, though not entirely eliminated, by using graphical methods.

Graphs help in the following ways:

When multiple data points are plotted on a graph, the trend or pattern can be identified despite the presence of random errors. This trend typically represents the underlying relationship between the measured variables.

In a graph, outliers or points that deviate significantly from the rest can be more easily recognized. This helps assess whether a particular measurement might be erroneous or influenced by a random error.

A line of best fit or curve fitting techniques is applied to the plotted data points. This reduces the impact of individual erroneous points by averaging their effects, thus minimizing the impact of random errors. In doing so, the resulting line or curve reflects the average behavior more than the discrepancies caused by these errors.

Graphical representation helps visualize the data distribution, making it easier to infer the reliability and consistency of the measurements taken during the experiment.

By evaluating the linearity or curvature of the data, systematic biases may become apparent. However, the primary advantage concerning errors focuses on random errors, since systematic errors often require different analytical techniques for identification and correction.

These points align with choice C, recognizing that the most significant purpose of plotting a graph in the context of error reduction is addressing the effects of random errors on measurements. Thus, the correct answer is C.

2015-10A · MCQd2Practical Skills and Data Analysis · Purpose of repeat readings

(2015-10) In practical work, repeat readings are taken to make:
A. $\quad \text{the experiment a fair test}$
B. $\quad \text{the results more precise}$
C. $\quad \text{the results more accurate}$
D. $\quad \text{the results more reliable}$
E. $\quad \text{All of the above}$

Reveal answer
AnswerD
Show worked solution

In experimental physics, taking repeat readings serves several purposes, primarily centered around enhancing the quality and trustworthiness of the data obtained. The reasoning behind each of the options given can be analyzed as follows:

The purpose of making an experiment a "fair test" is generally ensured by controlling variables, using appropriate methods, and ensuring consistent conditions. Repeat readings do not fundamentally alter the fairness of a test; they instead relate to data assessment.

Precision refers to the consistency of repeat measurements rather than their closeness to the true value. Precision is enhanced when repeat measurements yield values that are closely grouped together, indicating reduced random error. However, repeat readings primarily address reliability rather than precision.

Accuracy indicates the closeness of a measurement to the true value. While taking repeated measurements can help identify systematic errors affecting accuracy, they do not directly improve accuracy unless supplemented with analysis or correction strategies.

Reliability is closely related to the consistency and stability of results across multiple attempts. By obtaining repeat readings, one can verify the consistency of the measurements. If readings are repeatable and show little variation, they increase confidence in the results, enhancing reliability.

Thus, the key function of repeat readings in an experimental context is to make the results more reliable by providing a means to confirm the consistency and stability of the experimental results through repeated trials.

Therefore, the correct option in the context of the given problem is:

$$ \mathrm{D: the results more reliable} $$

2016-9A · MCQd2Practical Skills and Data Analysis · Accuracy vs precision vs reliability

(2016-9) In a Hookes law experiment, a student uses a ruler with a $1 / 2 \mathrm{~mm}$ scale rather than the more usual 1 mm scale to measure the extension of the spring. They repeat the measurements several times.

Which line in the table below describes the benefits of these measurement techniques?

Using a $1 / 2 \mathrm{~mm}$ scale:Repeating the measurements:
A.\begin{tabular}{l} Increases the accuracy of the
readings

&

Increases the reliability of the
readings

\hline B. &
Increases the accuracy of the
readings

&

Ensures the investigation is a fair
test

\hline C. &
Increases the precision of the
readings

&

Increases the reliability of the
readings

\hline D. &
Increases the precision of the
readings

&

Ensures the investigation is a fair
test

\hline E. &
Increases the reliability of the
readings

&

Increases the reliability of the
readings

\hline \endtabular
Reveal answer
AnswerC
Show worked solution

To solve the problem, we need to carefully consider the terminology used in the context of measurement in physics: precision, accuracy, reliability, and fairness.

Firstly, let's analyze the impact of using a $1/2 \, \text{mm}$ scale:

The term "precision" in measurement refers to the degree of refinement or exactness with which a measurement is made. A ruler with a $1/2 \, \text{mm}$ scale is more precise than one with a $1 \, \text{mm}$ scale because it allows for measurements to be made in increments of $0.5 \, \text{mm}$ rather than $1 \, \text{mm}$. This smaller increment allows for smaller variations to be recorded, leading to a finer resolution of measurement.

Therefore, using a $1/2 \, \text{mm}$ scale increases the precision of the readings.

Now, consider the effect of repeating the measurements:

When a student repeats measurements of the spring's extension multiple times, they are practicing repeated trials. This repetition helps identify any anomalies in the data and provides a means to average the results, which reduces random errors.

In experimental contexts, "reliability" refers to the consistency of a set of measurements or of a measuring instrument. Repeated measurements increase the reliability of the readings because they allow for a more consistent data set and reduce the impact of random errors.

Therefore, repeating the measurements increases the reliability of the readings.

Now, let's match our analysis to the options in the table:

- Using a $1/2 \, \text{mm}$ scale increases the precision of the readings. - Repeating the measurements increases the reliability of the readings.

Upon reviewing the options, we find that Option C correctly describes these two benefits:

- Increases the precision of the readings - Increases the reliability of the readings

Thus, the correct answer is C.

2017-2A · MCQd2Practical Skills and Data Analysis · Unit conversion & powers of ten

(2017-2) In particle accelerators such as those at CERN, particle energies are measured in giga electronvolts (GeV) where $1 \mathrm{eV} = 1.60 \times 10^{-19} \mathrm{~J}$. Giga is a unit prefix meaning $10^9$. A particle has an energy of 920 GeV. The energy of the particle in joules is:
A. $\quad 1.74 \times 10^{-22} \mathrm{~J}$
B. $\quad 1.47 \times 10^{-16} \mathrm{~J}$
C. $\quad 1.47 \times 10^{-7} \mathrm{~J}$
D. $\quad 5.72 \times 10^{21} \mathrm{~J}$
E. $\quad 5.72 \times 10^{30} \mathrm{~J}$

Reveal answer
AnswerC
Show worked solution

To convert the energy from giga electronvolts (GeV) to joules (J), begin with the energy measurement given in the problem. The energy of the particle is given as 920 GeV. First, understand that giga (G) as a unit prefix represents $10^9$, so:

$$ 920 \, \mathrm{GeV} = 920 \times 10^9 \, \mathrm{eV} $$

Next, use the conversion factor for electronvolts to joules. The problem gives the conversion $1 \, \text{eV} = 1.60 \times 10^{-19} \, \text{J}$. Now convert the energy from electronvolts to joules by multiplying:

$$ 920 \times 10^9 \, \mathrm{eV} \times 1.60 \times 10^{-19} \, \mathrm{J/eV} $$

To do this multiplication, multiply the numerical coefficients and apply the laws of exponents:

$$ 920 \times 1.60 \times (10^9 \times 10^{-19}) \, \mathrm{J} $$

$$ = 1472 \times 10^{-10} \, \mathrm{J} $$

Now, simplify the expression by adjusting the powers of ten:

$$ = 1.472 \times 10^{-7} \, \mathrm{J} $$

The energy of the particle is thus $1.472 \times 10^{-7} \, \text{J}$, which matches the closest value among the given options, specifically:

$$ 1.47 \times 10^{-7} \, \mathrm{J} $$

Therefore, the correct answer is C.

2017-8A · MCQd3Practical Skills and Data Analysis · Systematic error from graph intercept

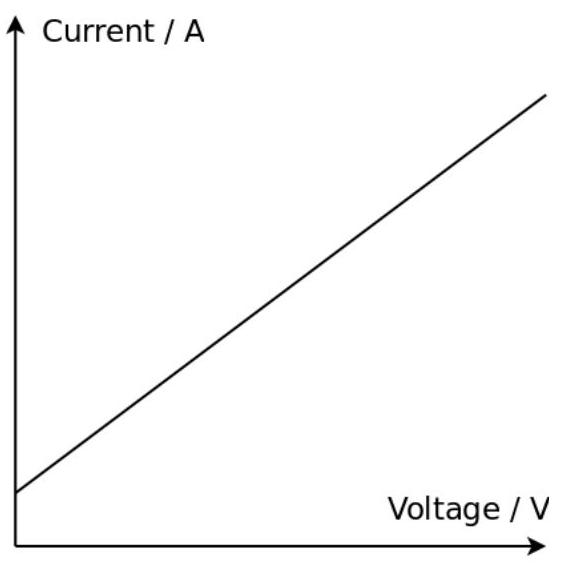
(2017-8) A student measures the potential difference across a fixed value resistor and also measures the current through the resistor. A graph of potential difference and current produces a straight line as shown. The graph shows that:

figure

A. $\quad \text{Current is directly proportional to potential difference}$
B. $\quad \text{The voltmeter was consistently reading more than it should do}$
C. $\quad \text{The ammeter was consistently reading more than it should do}$
D. $\quad \text{The ammeter and voltmeter were connected incorrectly}$
E. $\quad \text{The resistance of the ammeter affected the measurements}$

Reveal answer
AnswerC
Show worked solution

When a student measures the potential difference (voltage) and current across a resistor and plots their relationship on a graph, Ohm's Law is often tested. According to Ohm's Law, the current $I$ through a resistor is directly proportional to the voltage $V$ across it. The relationship can be expressed as

$$ V = IR $$

where $R$ is the resistance of the resistor.

On a graph where the potential difference $V$ is plotted on the y-axis and the current $I$ on the x-axis, if the relationship is perfectly proportional, the graph should be a straight line passing through the origin with a slope equal to the resistance $R$.

Deviation from this expected straight-line behavior can indicate issues with measurement or equipment. Let's evaluate the given options:

- If the current is directly proportional to the potential difference, the equation $V = IR$ holds true without any offsets, and we should see a straight line through the origin.

- If the voltmeter was consistently reading more than it should, the voltage values would be higher than expected, causing the data points to shift upwards, but still form a straight line.

- If the ammeter was consistently reading more than it should, the current values would appear higher than expected. This would make the slope of the line on the graph steeper than the actual resistance, suggesting a higher current for the same potential difference.

- Incorrect connections of the ammeter or voltmeter could result in varied incorrect data that would not fit a simple linear model at all.

- If the resistance of the ammeter affected the measurements, a non-linear distortion would be likely due to the voltage drop across the ammeter itself, rather than a consistent linear offset.

Given these considerations, choice (C) is the most logical. If the ammeter consistently reads higher current than the actual value, it skews the data to create an erroneously larger slope on a graph plotting current versus potential difference, which corresponds to a greater apparent current for any given voltage-precisely the behavior indicated by choice (C).

2018-8A · MCQd3Practical Skills and Data Analysis · Systematic error & percentage error

(2018-8) A crude method to measure the speed of sound involves banging two wooden blocks together to produce a sharp sound. One person bangs the blocks together. A second person uses a trundle wheel or tape measure to stand 100 m away. When the second person sees the blocks hit, they start a stopwatch. When they hear the bang, they stop the stopwatch.

Using this method a value of $420 \mathrm{~m}/\mathrm{s}$ was measured for the speed of sound. The accepted value is $340 \mathrm{~m}/\mathrm{s}$.

The most likely reason for the difference between the measured and accepted value is:
A. $\quad \text{The time measurement is too short}$
B. $\quad \text{The time measurement is too long}$
C. $\quad \text{The distance measurement is too small}$
D. $\quad \text{The distance measurement is too big}$
E. $\quad \text{The speed of light was not taken in to account}$

Reveal answer
AnswerA
Show worked solution

The technique involves measuring the time it takes for sound to travel a known distance. The speed of sound $v$ can be calculated using the formula:

$$ v = \frac{d}{t} $$

where $d$ is the distance and $t$ is the time taken for sound to cover that distance.

Here, $d = 100 \, \text{m}$, and the measured speed of sound is $420 \, \text{m/s}$. Using these values, we can find the measured time $t_{\text{measured}}$:

$$ t_{ \mathrm{measured} } = \frac{d}{v_{ \mathrm{measured} }} = \frac{100}{420} $$

The accepted speed of sound is $v_{\text{accepted}} = 340 \, \text{m/s}$. Using this accepted value, the actual time $t_{\text{accepted}}$ should be:

$$ t_{ \mathrm{accepted} } = \frac{d}{v_{ \mathrm{accepted} }} = \frac{100}{340} $$

Comparing $t_{\text{measured}}$ and $t_{\text{accepted}}$, if $v_{\text{measured}} > v_{\text{accepted}}$, then $t_{\text{measured}} < t_{\text{accepted}}$. This implies that the measured time was shorter than it should have been.

Therefore, the discrepancy between the measured and accepted values of the speed of sound is due to the time measurement being too short.

2019-4A · MCQd2Practical Skills and Data Analysis · Random vs systematic error

(2019-4) Standard 100 g masses used in physics experiments can be checked using a digital top-pan balance. When a sample of five 100 g masses is checked, the values for five different masses are recorded as $100.6 \mathrm{~g}, 99.4 \mathrm{~g}, 99.3 \mathrm{~g}, 100.5 \mathrm{~g}$ and 100.2 g .

When students use any number of 100 g masses in routine experimental work, without measuring the individual masses, the variation in the actual mass is an example of:
A. $\quad \text{Calculation error}$
B. $\quad \text{Human error}$
C. $\quad \text{Parallax error}$
D. $\quad \text{Random error}$
E. $\quad \text{Systematic error}$

Reveal answer
AnswerD
Show worked solution

To solve this problem, we need to classify the type of error present when using masses in routine experimental work without measuring the individual masses. The given recorded values of the masses are $100.6 \, \mathrm{g}$, $99.4 \, \mathrm{g}$, $99.3 \, \mathrm{g}$, $100.5 \, \mathrm{g}$, and $100.2 \, \mathrm{g}$.

In this context, we are investigating the variability or deviation of the individual masses from the expected nominal value of $100 \, \mathrm{g}$ during normal usage in experiments. Let's examine each type of error outlined in the options:

Calculation error refers to mistakes made while performing mathematical operations. This does not apply here as we are dealing with the measurement of masses, not calculations.

Human error is related to mistakes made by the person conducting the experiment, such as reading a measuring device incorrectly. Since the problem involves using a digital balance, human error is unlikely because the balance provides a direct measurement.

Parallax error occurs when measurements are read from an angle rather than directly in line with the scale. It pertains to analog devices and not digital balances, hence it is not applicable here.

Random error arises from unpredictable and uncontrollable fluctuations in readings. It affects the precision of measurements and results in variability around a mean value. The varied results ($100.6 \, \mathrm{g}$, $99.4 \, \mathrm{g}$, $99.3 \, \mathrm{g}$, $100.5 \, \mathrm{g}$, and $100.2 \, \mathrm{g}$) indicate such random deviations from the nominal value of $100 \, \mathrm{g}$.

Systematic error is consistent and repeatable error that shifts all measurements in a specific direction, hence it affects the accuracy rather than the precision of measurements.

Considering the variations in the values without any consistent shift in one direction, the errors are due to random fluctuations from one measurement to another. Therefore, the correct classification of the error in this scenario is a random error.

Thus, the correct answer is option D, which denotes random error.

2020-1A · MCQd2Practical Skills and Data Analysis · Gradient technique (density)

(2020-1) A student measures the density of water by determining the mass and volume of several different quantities of water.
The student plots the measured values of mass and volume on a graph.
How should the student determine the density of water from the graph?

Quantity on the $y\text{-axis}$Quantity on the $x\text{-axis}$Determine the density from the:
A.volumemassgradient
B.volumemassarea
C.massvolumegradient
D.massvolumearea
Reveal answer
AnswerC
Show worked solution

To determine the density of water using a graph of mass versus volume, we need to understand the relationship between these quantities through the definition of density.

The density $\rho$ of a substance is defined by the equation:

$$ \rho = \frac{m}{V} $$

where $m$ is the mass and $V$ is the volume.

When plotting a graph of mass versus volume, we typically choose one of the quantities to be on the vertical axis and the other on the horizontal axis. For the task of determining density, the quantity on the y-axis is critical because it determines the variable of interest when calculating the gradient.

Consider the graph as follows:

- Quantity on the y-axis: mass - Quantity on the x-axis: volume

The gradient of a line in this graph is given by:

$$ \mathrm{Gradient} = \frac{\Delta m}{\Delta V} $$

where $\Delta m$ is the change in mass and $\Delta V$ is the change in volume.

Referring to the definition of density, if the graph is a straight line through the origin, the gradient of the line represents the density $\rho$, since:

$$ \rho = \frac{m}{V} = \frac{\Delta m}{\Delta V} $$

Thus, when mass is plotted on the y-axis and volume is plotted on the x-axis, the gradient of the line corresponds to the density of water.

This corresponds to option C in the given problem, where one determines the density from the gradient of the line when mass is plotted on the y-axis and volume is plotted on the x-axis.

2020-7A · MCQd2Practical Skills and Data Analysis · Significant figures

(2020-7) A student measures the mass and acceleration of a trolley and calculates the resultant force. The mass of the trolley was measured to be 0.984 kg and the acceleration was determined to be $1.2 \mathrm{~m} / \mathrm{s}^{2}$.

The student correctly calculates the resultant force to be $\mathrm{F}=1.1808 \mathrm{~N}$.
The force should be recorded as:
A. $\quad 1 \mathrm{~N}$
B. $\quad 1.2 \mathrm{~N}$
C. $\quad 1.18 \mathrm{~N}$
D. $\quad 1.181 \mathrm{~N}$
E. $\quad 1.1808 \mathrm{~N}$

Reveal answer
AnswerB
Show worked solution

$$ F = ma $$

In this problem, the mass $m$ of the trolley is given as 0.984 kg, and the acceleration $a$ is stated to be $1.2 \, \mathrm{m/s}^2$. To find the force $F$, multiply the mass and acceleration:

$$ F = 0.984 \, \mathrm{kg} \times 1.2 \, \mathrm{m/s}^2 $$

Calculating this gives us:

$$ F = 1.1808 \, \mathrm{N} $$

To determine the appropriate number of significant figures for the result, note the significant figures in the given measurements. The mass has three significant figures (0.984), while the acceleration has two significant figures (1.2). The result should be reported in the fewest number of significant figures present in the given quantities, which is two significant figures.

Therefore, the force should be rounded to two significant figures:

$$ F = 1.2 \, \mathrm{N} $$

Thus, the force should be recorded as option B, $1.2 \, \mathrm{N}$.

2020-8A · MCQd4Practical Skills and Data Analysis · Systematic error & percentage error

(2020-8) A student predicts that a steel ball dropped from rest from a height of 2 m will hit the floor after 0.63 seconds. In their calculation they used an approximate value for the acceleration due to gravity of $g=10 \mathrm{~m} / \mathrm{s}^{2}$.

The accepted value for the acceleration due to gravity is $\mathrm{g}=9.8 \mathrm{~m} / \mathrm{s}^{2}$.
This means their calculated time will be:
A. $\quad \text{unaffected}$
B. $\quad \text{too long by about }1\%$
C. $\quad \text{too short by about }1\%$
D. $\quad \text{too long by about 0.2 seconds}$
E. $\quad \text{too short by about 0.2 seconds}$

Reveal answer
AnswerC
Show worked solution

To determine how the calculated time is affected by using an approximate value for the acceleration due to gravity, we must consider the kinematic equation for an object in free fall:

$$ h = \frac{1}{2} g t^2 $$

where $h$ is the height from which the object is dropped, $g$ is the acceleration due to gravity, and $t$ is the time taken for the object to hit the ground.

For the student's calculation, using $g = 10 \, \text{m/s}^2$:

$$ 2 = \frac{1}{2} \times 10 \times t^2 $$

Solving for $t$:

$$ 2 = 5t^2 $$

$$ t^2 = \frac{2}{5} $$

$$ t = \sqrt{\frac{2}{5}} $$

Evaluating this:

$$ t \approx 0.6325 $$

which is approximately 0.63 seconds.

For the accepted value of gravity, $g = 9.8 \, \text{m/s}^2$:

$$ 2 = \frac{1}{2} \times 9.8 \times t^2 $$

Solving for $t$:

$$ 2 = 4.9t^2 $$

$$ t^2 = \frac{2}{4.9} $$

$$ t = \sqrt{\frac{2}{4.9}} $$

Evaluating this:

$$ t \approx 0.639 $$

Now, calculate the percentage error:

The difference in time is:

$$ 0.639 - 0.63 = 0.009 $$

The percentage error relative to the more accurate time is:

$$ \mathrm{Percentage error} = \left(\frac{0.009}{0.639}\right) \times 100\% \approx 1.4\% $$

Since the student's calculated time $(0.63 \text{ s})$ is less than the more accurate time $(0.639 \text{ s})$, their time is too short. However, they asked about an approximate 1% deviation, suggesting the answer closest to the situation is that the time is:

$$ \mathrm{too short by about 1\%} $$

Thus, the correct choice is C.

2022-1A · MCQd3Practical Skills and Data Analysis · Graph shape matching

(2022-1) The graph shows:

figure

A. $\quad \text{Current vs Potential difference for a fixed resistor}$
B. $\quad \text{Kinetic energy vs velocity for a fixed mass}$
C. $\quad \text{Pressure vs Volume at a constant temperature for a fixed mass of gas}$
D. $\quad \text{Mass of a beaker containing water vs volume of water in the beaker at a fixed temperature}$

Reveal answer
AnswerD
Show worked solution

The problem requires us to match the correct physical interpretation to the provided graph. Let's analyze each option to understand why Option D is the correct choice:

For Option A, the relationship between current (I) and potential difference (V) for a fixed resistor is described by Ohm's Law, $V = IR$, where $R$ is the resistance. The graph representing this relationship is a straight line passing through the origin in the $I-V$ plane, indicating a linear relationship.

For Option B, the kinetic energy ($KE$) versus velocity ($v$) for a fixed mass is given by the formula $KE = \frac{1}{2}mv^2$. This relationship is quadratic, leading to a parabolic curve opening upwards when plotting kinetic energy against velocity.

For Option C, the relationship between pressure (P) and volume (V) for a fixed mass of gas at constant temperature is given by Boyle's Law, $PV = \text{constant}$. This results in a hyperbolic curve when plotting pressure against volume, not a straight line.

In Option D, the mass of a beaker containing water versus the volume of water at a fixed temperature is directly proportional. The density ($\rho$) of water remains constant, so the mass ($m$) is given by $m = \rho \cdot V$. This relationship is linear, showing a straight-line graph passing through the origin, characteristic of direct proportionality.

Given the above explanations, the graph must show a linear relationship through the origin, which aligns with Option D. Hence, the correct option is D.

2023-6A · MCQd1Practical Skills and Data Analysis · Purpose of repeat readings

(2023-6) In practical work, repeat readings are taken to:
A. $\quad \text{Reduce the effect of random errors}$
B. $\quad \text{Reduce the likelihood of a mistake being made}$
C. $\quad \text{Reduce any systematic errors}$
D. $\quad \text{Ensure a fair test}$

Reveal answer
AnswerA
Show worked solution

In experimental physics, measurements are prone to various types of errors. It is essential to understand the nature of these errors to improve the reliability and accuracy of the results.

Random errors are errors that cause scatter in measured data points about a mean value. These errors can arise from unpredictable fluctuations in the measuring process or from environmental changes that are difficult to control. Repeat readings help to average out these random fluctuations, thereby providing a more accurate estimate of the true value. By taking multiple readings and calculating their average, the effect of random errors is reduced.

$$ \bar{x} = \frac{\sum_{i=1}^{n} x_i}{n} $$

where $\bar{x}$ is the average of the measurements, $x_i$ are individual measurements, and $n$ is the number of measurements. The standard deviation $\sigma$ of these measurements can provide an estimate of the random error:

$$ \sigma = \sqrt{\frac{\sum_{i=1}^{n} (x_i - \bar{x})^2}{n-1}} $$

Taking more measurements (increasing $n$) reduces the uncertainty in the measurement, as the standard error of the mean decreases:

$$ \mathrm{Standard Error} = \frac{\sigma}{\sqrt{n}} $$

Systematic errors, on the other hand, are consistent, repeatable errors associated with faulty equipment or bias in observation. These errors shift all measurements in the same direction and cannot be reduced by taking multiple readings. To address systematic errors, calibration of the apparatus or correction of the experimental setup is necessary.

Mistakes, often caused by human error such as recording data incorrectly, are best managed through careful attention and verification, rather than repeat readings.

The concept of a fair test refers to ensuring that the experiment's integrity is maintained by controlling variables adequately and maintaining consistency. It is more related to the experimental design rather than to errors in measurements.

Thus, the primary reason for taking repeat readings in practical work is to reduce the effect of random errors, making option A the correct answer.

2024-10A · MCQd4Practical Skills and Data Analysis · Systematic error from graph intercept

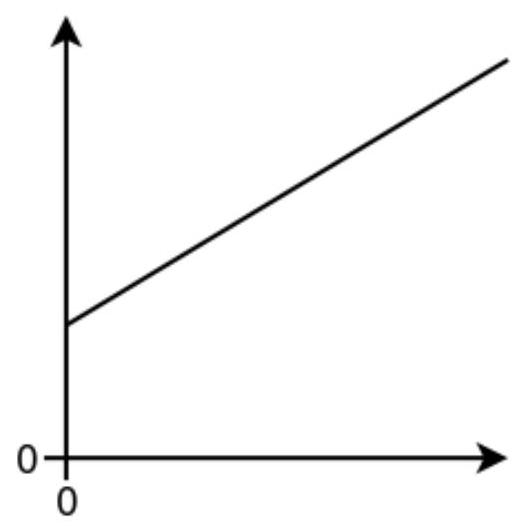
(2024-10) A student carried out an experiment to measure the acceleration due to gravity by dropping a steel ball through a height ($h$) and recording the time taken ($t$). The student plotted a graph of the results, expecting a straight line through the origin. However, they obtained a straight line that did not pass through the origin, as shown.

The difference between the actual and expected results can be explained by:

A.the measured height being greater than the true height
B.the measured height being less than the true height
C.the recorded time being less than the true time taken
D.the value for $g$ being less than expected
Reveal answer
AnswerA
Show worked solution

For an object dropped from rest under constant acceleration due to gravity, the distance fallen is related to the time by: $$ h = \frac{1}{2}gt^{2} $$

Rearranging, we get: $$ h = \left( \frac{g}{2} \right) t^{2} $$

If the student plots $h$ on the vertical axis against $t^{2}$ on the horizontal axis, they should obtain a straight line passing through the origin $(0,0)$ with gradient $g/2$.

However, the student obtained a straight line that does not pass through the origin -- it has a positive $h$-intercept. This means that for any given value of $t^{2}$, the measured height $h$ is larger than expected by a constant amount.

The most plausible explanation is a systematic error in the height measurement. If the student consistently measures the height as being greater than its true value (for example, due to always measuring from an incorrect reference point, or due to a zero-offset error in the measurement device), then each measured height would be: $$ h_{\text{measured}} = h_{\text{true}} + \text{constant error} $$

Substituting $h_{\text{true}} = \frac{1}{2}gt^{2}$: $$ h_{\text{measured}} = \frac{1}{2}gt^{2} + \text{constant error} $$

This equation represents a straight line with gradient $g/2$ and a positive $h$-intercept equal to the constant measurement error. The slope (and therefore the calculated value of $g$) would still be correct, but the line would not pass through the origin.

2025-7A · MCQd3Practical Skills and Data Analysis · Measurement error propagation

(2025-7) A student determines acceleration of a trolley on a ramp using a light gate and interrupt card. The measured card length is 4.0 cm but the correct length is 3.8 cm.

How does this error affect the calculated velocity and acceleration?

VelocityAcceleration
ACalculated value is too highCalculated value is too high
BCalculated value is too lowCalculated value is too high
CCalculated value is too highCalculated value is too low
DCalculated value is too lowCalculated value is too low
Reveal answer
AnswerA
Show worked solution

To determine how this measurement error affects the calculated values, we need to understand how velocity and acceleration are calculated from the experimental data.

The velocity of the trolley as it passes through the light gate is calculated using: $$ v = \frac{L}{t} $$ where $L$ is the length of the interrupt card and $t$ is the time recorded by the light gate.

The student measures the card length as $L_{\text{measured}} = 4.0\ \mathrm{cm}$, but the true length is $L_{\text{true}} = 3.8\ \mathrm{cm}$. The measured length is about $5\%$ too large ($4.0/3.8 \approx 1.05$).

Since the calculated velocity is directly proportional to the card length ($v \propto L$ for a fixed time $t$), using an overestimated card length will give an overestimated velocity: $$ v_{\text{calculated}} = \frac{4.0}{3.8} \times v_{\text{true}} \approx 1.05 \times v_{\text{true}} $$

For acceleration, the trolley starts from rest and travels a distance $d$ down the ramp. The velocity at the light gate is related to the acceleration by: $$ v^{2} = 2ad \quad \Rightarrow \quad a = \frac{v^{2}}{2d} $$

Since the calculated acceleration depends on the square of the velocity ($a \propto v^{2}$), and the velocity is overestimated by about $5\%$, the acceleration will be overestimated by about $(1.05)^{2} \approx 1.10$, or $10\%$.

Therefore, both the velocity and acceleration are calculated as too high.